
The HEI can also be used to evaluate nutrition interventions and consumer nutrition education initiatives and is a useful tool for epidemiologic and economic research. The most recent version of the HEI is the Healthy Eating Index–2015.
The HEI is a scoring system that can be used to assess the overall quality of a diet as well as the quality of individual dietary factors.
Dietary quality has improved over time, but it is still low, with the majority of people’s failing to fulfil federal dietary requirements. Obesity, diabetes, cardiovascular disease, and cancer are all chronic diseases that can be reduced by improving nutrition quality across the population. Food environment changes have been found to enhance diet, avoid obesity, and reduce chronic disease risk.
Because food environment research is scalable and frequently includes policy levers, it is critical to comprehend how food outlets influence diet quality at the population level.
The Healthy Eating Index is one way to quantify and track the quality of the population’s diet (HEI). The HEI assesses how closely a group of foods adheres to the Dietary Guidelines. Every five years, the DGA is changed, and an updated HEI that reflects those changes is produced to match with the new DGA. The HEI-2015 is the most recent version of the HEI, and it was created to correspond to the DGA for the years 2015–2020.
The HEI is a density-based dietary metric that assesses food quality rather than quantity and is based on a set of universal standards. The HEI can be used to assess the quality of any combination of foods thanks to these two qualities. Diet quality may be compared between levels and between different types of food outlets when applied to various levels of the food chain.
Food banks, food assistance programmes, fast food restaurants, goods marketed in grocery circulars, and schools have all used the HEI-2015 and prior versions of the HEI to examine various levels of the food supply chain. Much of the past research has focused on food quality in terms of what is offered, advertised, distributed, or sold. The potential for quality differences among foods consumed at these establishments is less well established.
The National Health and Nutrition Examination Survey (NHANES) is a source of nationally representative data on people’s diets and the origins of the foods they eat. The NHANES data have been used to investigate the quality of meals consumed at schools and restaurants. Diet quality was assessed in a recent study using two different diet quality ratings. Using the most recent NHANES data and the recommended analytical technique, the population ratio method, to create HEI-2015 ratings.
Methods

The dietary component of the cross-sectional National Health and Nutrition Examination Survey, What We Eat here, provides data on national dietary intake by food outlet. The NHANES is carried out by the Centers for Disease Control and Prevention’s National Center for Health Statistics (NCHS). The National Health and Nutrition Examination Survey is a biannual survey that takes place every two years. The NHANES statistics are representative of the civilian population because of the complicated multistage probability cluster sampling design.
NHANES participants fill out surveys at home, then go to a mobile exam centre (MEC) for physical measurements and more questionnaires, with the final questionnaires being completed over the phone. The Automated Multiple Pass Method [26] is used to collect nutritional data using 24-hour recalls (24-hour recalls).
Two 24-hour recall interviews are conducted, the first in-person at the NHANES mobile exam centre and the second over the phone. All NHANES study protocols were evaluated and approved by the NCHS Research Ethics Review Board. This study was exempt from further evaluation since all NHANES data were de-identified and did not contain sensitive information.
Retail food outlets are defined as all food sources other than restaurants where food is purchased and consumed off-premises by customers. Grocery stores and supermarkets, as well as convenience stores, are retail food establishments. Grocery stores/supermarkets and convenience stores use similar intervention methods, such as the four Ps of marketing. In the literature, grocery/supermarket and convenience stores are commonly examined jointly and both are included in a national research agenda for healthy food retail research. As a result, grocery shops/supermarkets and convenience stores were merged into a single food retail outlet category for the sake of this study, which was dubbed “stores.”
Stores, full-service restaurants, quick-service restaurants, and schools were the last categories of food outlets. This categorization of food outlets was based on the 2015 Dietary Guidelines Advisory Committee’s Scientific Report, which compared food group density over time at each of the four major types of food outlets: stores, full-service restaurants, quick-service restaurants, and schools [30]. In four ways, this study builds on the work of the 2015 DGAC:
- including the most recent NHANES cycles into the analysis
- computing the HEI-2015 component and total scores for each of the four primary categories of food outlets;
- utilising the population ratio approach to compare patterns of HEI-2015 component scores between various food outlets; and
- studying variations in HEI-2015 component scores.
Index of Good Eating

Comparing the quality and pattern of foods consumed from each of the four food outlets of interest was done using the total HEI-2015 score and the pattern of HEI-2015 component scores. The HEI-2015 requirements are based on the 2015–2020 Dietary Guidelines, with a total score of 100 indicating optimal alignment with the DGA [3,10]. The HEI-2015 is made up of thirteen parts, each of which represents a different facet of diet quality.
Total fruits, entire fruits, total vegetables, greens and beans, whole grains, dairy, total protein foods, seafood and plant proteins, and fatty acid ratio are nine components that focus on adequacy, or foods to eat enough of to receive the nutrients needed for optimum health. Refined carbohydrates, salt, saturated fats, and added sugars are four components that should be consumed in moderation. High component scores indicate that the food mix adheres to federal dietary guidelines, while low values suggest that it does not.
The population ratio approach was used to derive HEI scores from the NHANES 24 hour recall. Although a recent study estimated HEI-2015 scores as the mean per-person food quality, previous studies have demonstrated that the population ratio method yields a less skewed estimate of mean HEI scores.
The population ratio technique is now recommended to calculate the mean total and component HEI scores to describe dietary intake for a community/group [24,32]. For each of the four primary categories,
The data on food outlets, nutrients, guidance-based food groupings, and calories were compiled with the help of a weighted sum, which is then converted into a density by dividing the total amount of each by the total amount of each nutrient or food group by the total number of calories consumed the acid ratio is calculated by dividing the total amount of mono- and polyunsaturated fatty acids by the total amount of saturated fatty acids. The component scores were scaled as a percentage of the greatest component score and then shown on radar plots to visualise differences in the patterns of the thirteen component scores. The centre point of the graph symbolises a score of zero, while the outside point of each axis represents the greatest score for each component on the radar plots. On the graph, each HEI-2015 component is represented by an axis, and the plot connects the scores for each axis into a figure that reveals a pattern based on its shape. For a total score of 100, a plot with all components at the outside point of the axis shows optimal alignment with the 2015–2020 DGA. As a result, a plot with many or the majority of points closer to the outer edge suggests a feeding pattern that is closer to following the 2015–2020 DGA standards than a plot with many points closer to the graph’s centre. To make comparisons easier, the components are displayed in the same order for each radar plot. The NCI website and the HEI-2015 update publication have more information on HEI visualisation and radar charts. An A–F grading scale can be used to interpret HEI scores.
Analytic Collection and Demographics
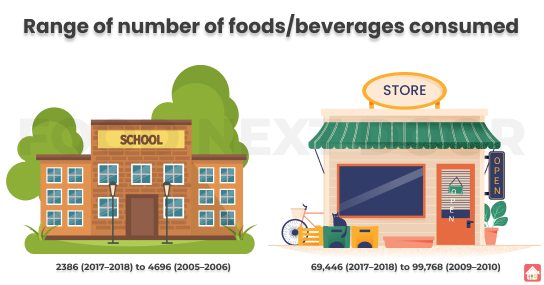
The study comprised NHANES participants aged 2 and up who had complete day-1 dietary recall data. Young children who consumed human milk and participants with unreliable recalls were eliminated. The analytic sample contained all reported foods and beverages from these reliable day-1 recalls. The final analytic sample had a different number of food/beverage items depending on the NHANES cycle. The number of foods/beverages consumed in schools ranged from 2386 in the 2017–2018 cycle to 4696 in the 2005–2006 cycle. The number of food/beverage items reported as consumed from stores ranged from 69,446 (2017–2018) to 99,768 (2009–2010).
Analytical Statistics

The amount of food and proportion of food consumed from each food outlet were computed to understand the distribution of consumption (measured in calories) among food outlets and by age. The calories consumed at each outlet were divided by the total calories consumed across all outlets, then multiplied by 100 to calculate the percentage of calories consumed per food outlet. The following age groups were used to stratify the distribution of the population’s total calorie intake: 2–5 years old, 6–11 years old, 12–19 years old, 20–40 years old, 41–50 years old, 51–70 years old, and over 70 years old. This estimate was not subjected to statistical significance tests because it was meant to provide an overview rather than a statistical comparison of the distribution of calories consumed from each food source. This calorie intake distribution by food outlet was used to supplement the findings and facilitate interpretation.
Weights for balanced repeated replication (BRR) were determined with a Fay’s coefficient of 0.3. To account for the NHANES’ complicated survey methodology, including the variable probability of selection and non-response, the BRR weights were utilised in analyses for both differences between outlets and differences over cycles. Each cycle’s BRR calculations were done independently, yielding eight BRR standard error values. To see if there were any significant differences in population mean HEI-2015 scores between retailers, full-service restaurants, quick-service restaurants, and schools, pairwise comparison tests were conducted. The confidence intervals were set at 0.95, and statistical significance was defined as a p-value of less than 0.05.
Consumption Patterns in Different Food Stores
The percentage of calories contributed by each food outlet to total caloric intake by age group, based on the most current NHANES cycle (2017–2018). Store-bought food accounted for the majority of calories consumed by people of all ages. The percentage of calories consumed from stores was lowest (60%) in those aged 12–19 years old and highest (78%) in those aged 71 and up. Quick-service restaurants contributed 7% (>71 years) to 22% (12–19 years and 20–40 years) of total calorie intake, whereas full-service restaurants contributed 3% (2–5 years) to 12% (41–50 years) of total calorie intake. Both types of restaurants consumed a comparable percentage of calories, which increased with age, peaked in maturity (20–40 years for quick-service, 41–50 years for full-service), and subsequently declined with age. Foods from schools contributed 6% of calories to the diets of children 2–5 years, 9% for children 6–11 years, and 5% for children 12–19 years for children and young adults under the age of 20.
Conclusions

This study provides nationally representative statistics on the food quality of the four primary categories of food outlets. People do not consume a variety of meals that match with the Dietary Guidelines from any of the main food outlets, and foods consumed from quick-service restaurants fall far short of national dietary guidelines. However, certain food establishments, particularly schools, have shown large increases in HEI-2015 scores over time. The rise in school scores coincides with the passage of the Healthy, Hunger-Free Kids Act, indicating a possible possibility for additional food outlets, such as stores and restaurants, to have policy impacts on the diet quality of the people.